5.6. Visualizing the ROS Graph with rqt_graph#
Now that you know the basics of ROS 2 nodes and topics on the CLI,
we will explore how to use rqt_graph to introspect ROS 2 topics in a more graphical manner.
Throughout this tutorial, we will use rqt_graph to visualize the changing nodes and topics as well as the connections between them.
5.6.1. Starting rqt_graph#
Before we run rqt_graph, let’s make sure we have a ROS graph containing some nodes and topics.
By now you should be comfortable starting up turtlesim.
Open a new terminal and run:
$ ros2 run turtlesim turtlesim_node
Open another terminal and run:
$ ros2 run turtlesim turtle_teleop_key
Recall from the previous tutorial that the names of these nodes are /turtlesim and /teleop_turtle by default.
Now to run rqt_graph, simply open a new terminal and enter the command (note that this is one command, with an underscore _ not a space ):
$ rqt_graph
Tip
This visual graph is just one of the manual Graphical User Interface (GUI) tools provided by ROS’s rqt framework.
You can also open rqt_graph, and many other visual tools, by first running rqt and selecting Plugins > Introspection > Node Graph.
You should see the above nodes and topic as well as two actions around the periphery of the graph (let’s ignore those for now). If you hover your mouse over the topic in the center, you’ll see the color highlighting like in the image above.
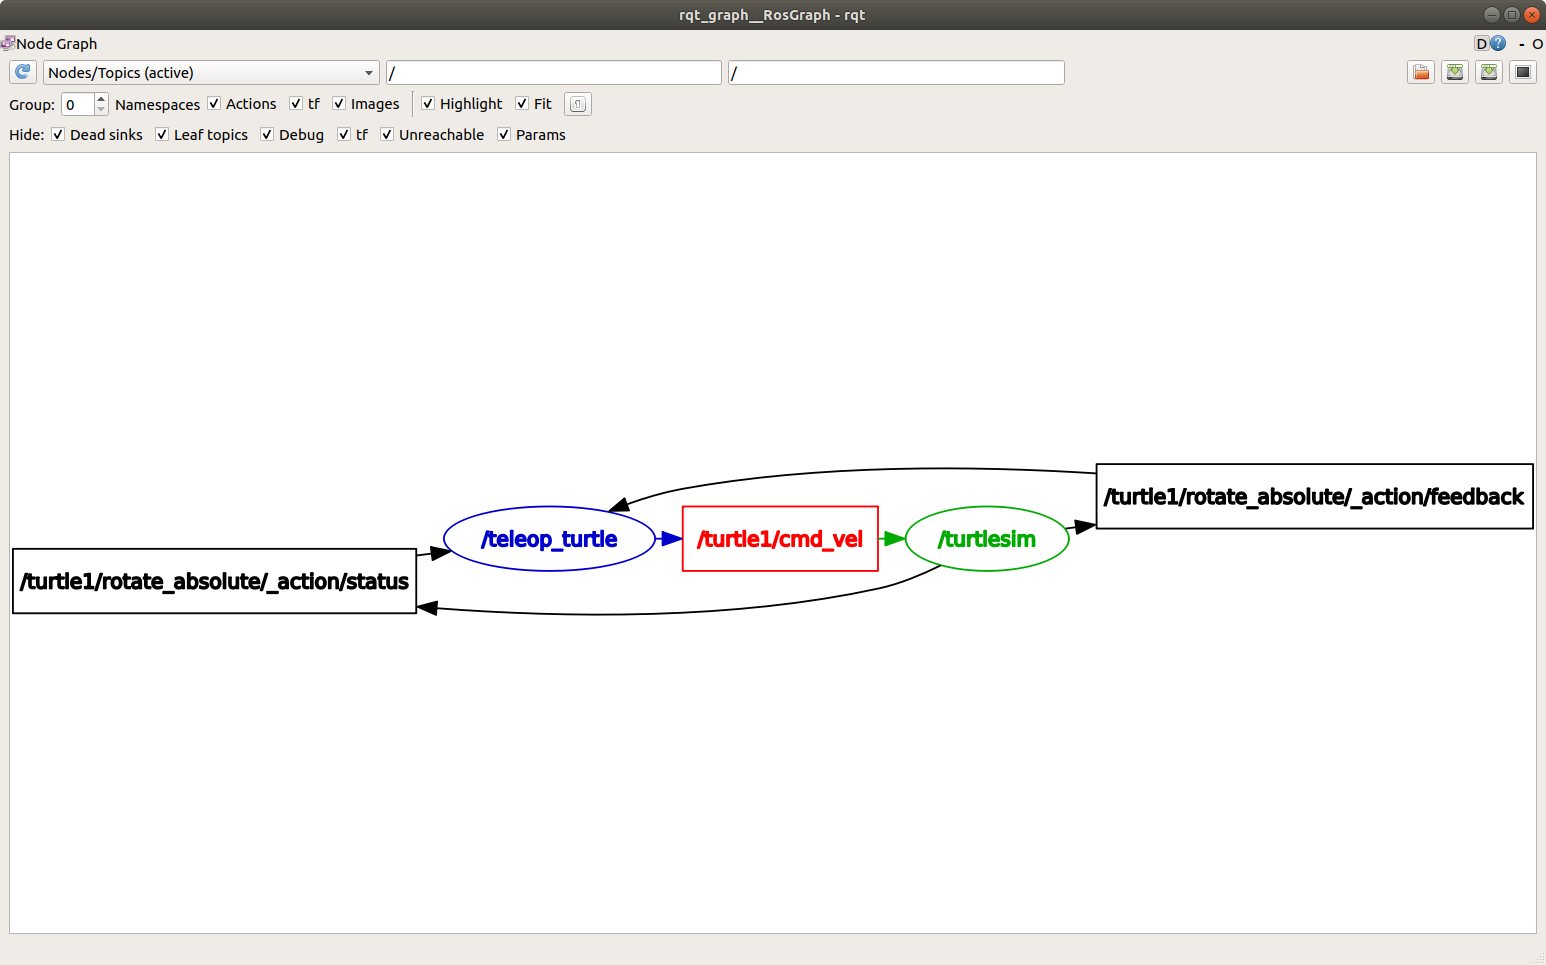
The graph is depicting how the /turtlesim node and the /teleop_turtle node are communicating with each other over a topic.
The /teleop_turtle node is publishing data (the keystrokes you enter to move the turtle around) to the /turtle1/cmd_vel topic, and the /turtlesim node is subscribed to that topic to receive the data.
The highlighting feature of rqt_graph is very helpful when examining more complex systems with many nodes and topics connected in many different ways.
5.6.2. Where are all my topics?#
Let’s compare the graphical representation from rqt_graph to the topic inspection from the ros2 topic list CLI tool that you use before.
Running the ros2 topic list -t command in a new terminal will return a list of all the topics currently active in the system (recall that -t will display the topic type appended in brackets):
$ ros2 topic list -t
/parameter_events [rcl_interfaces/msg/ParameterEvent]
/rosout [rcl_interfaces/msg/Log]
/turtle1/cmd_vel [geometry_msgs/msg/Twist]
/turtle1/color_sensor [turtlesim/msg/Color]
/turtle1/pose [turtlesim/msg/Pose]
These attributes, particularly the type, are how nodes know they’re talking about the same information as it moves over topics.
Warning
Look carefully, are all the topics listed using ros2 topic list also visible
in the rqt_graph window?
If you’re wondering where all these topics are in rqt_graph, you can uncheck all the boxes under Hide:
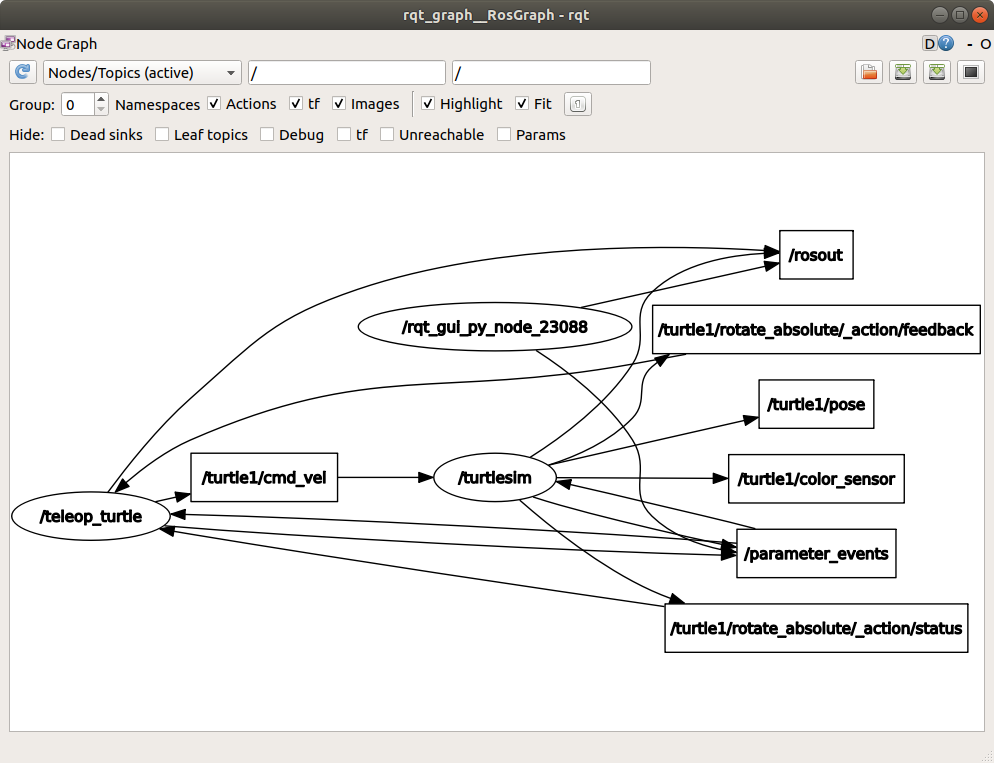
As you can see, rqt_graph hid by default topics that are not actively used to communicate between nodes!
For now, though, leave those “Hide” options checked to avoid confusion.
5.6.3. Display debug nodes with rqt_graph#
Recall that we can use ros2 topic echo to see the data being published on a topic:
$ ros2 topic echo <topic_name>
When you execute such an echo command, you are actually starting a new debug node which subscribes to the given topic, and simply prints the messages to the terminal. By default, such debug output is hidden by rqt_graph too, to avoid cluttering the graph. Let’s test it.
Since we know that /teleop_turtle publishes data to /turtlesim over the /turtle1/cmd_vel topic, let’s use echo to introspect that topic:
$ ros2 topic echo /turtle1/cmd_vel
At first, this command won’t return any data.
That’s because it’s waiting for /teleop_turtle to publish something.
Return to the terminal where turtle_teleop_key is running and use the arrows to move the turtle around.
Watch the terminal where your echo is running at the same time, and you’ll see position data being published for every movement you make:
linear:
  x: 2.0
  y: 0.0
  z: 0.0
angular:
  x: 0.0
  y: 0.0
  z: 0.0
  ---
Now return to rqt_graph and uncheck the Debug box.
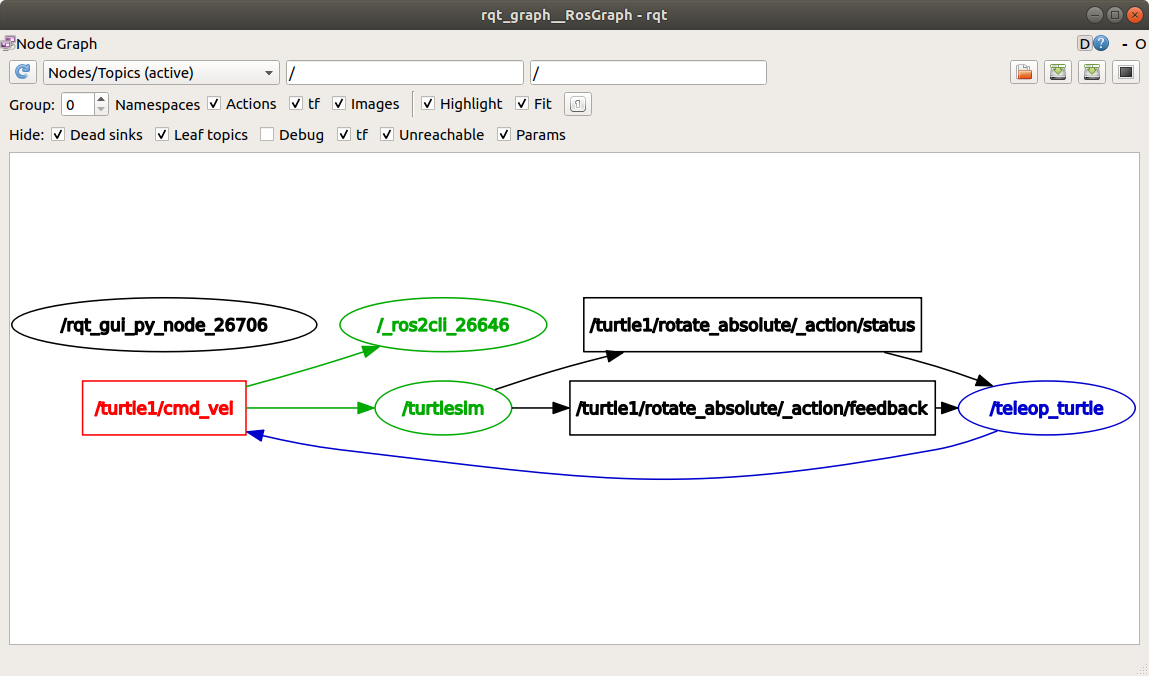
/_ros2cli_26646 is the node created by the echo command we just ran (the number might be different every time you run it!).
Now you can see that the publisher is publishing data over the cmd_vel topic, and two subscribers are subscribed to it.
Now lets use a basic ros2 topic pub command to make the turtle move in a circle again (as you did before) by publishing velocity commands at a rate of 1 Hz.
$ ros2 topic pub --rate 1 /turtle1/cmd_vel geometry_msgs/msg/Twist "{linear: {x: 2.0, y: 0.0, z: 0.0}, angular: {x: 0.0, y: 0.0, z: 1.8}}"
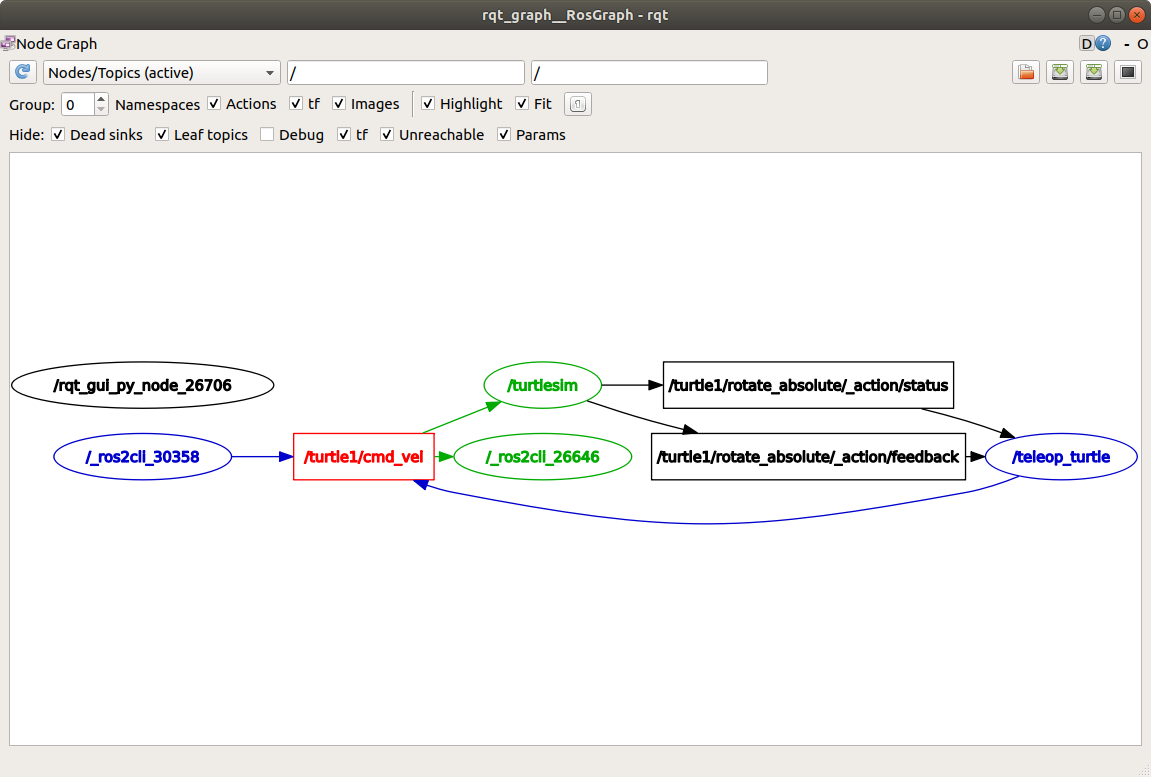
The turtle should keep moving, and you can refresh rqt_graph to see what’s happening graphically.
You will see that the ros2 topic pub ... node (/_ros2cli_30358) is publishing over the /turtle1/cmd_vel topic, which is being received by both the ros2 topic echo ... node (/_ros2cli_26646) and the /turtlesim node now.
Finally, you can run echo on the pose topic and recheck rqt_graph:
$ ros2 topic echo /turtle1/pose
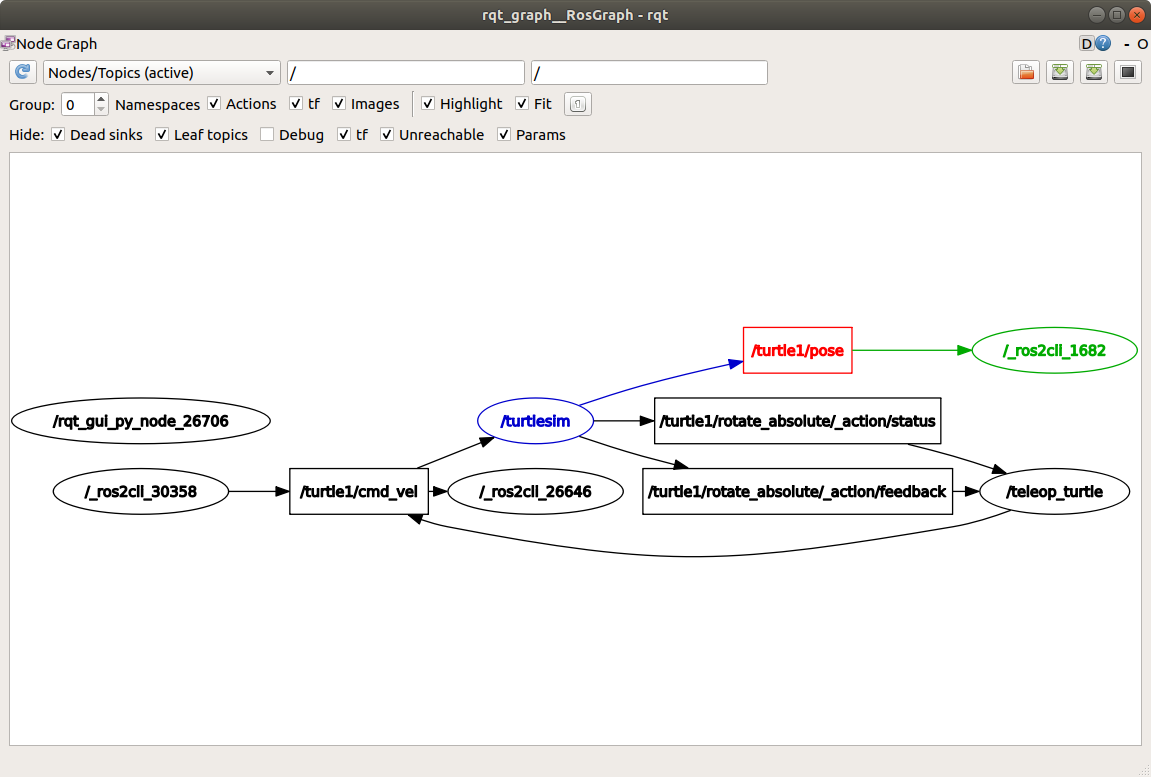
You can see that the /turtlesim node is also publishing to the pose topic, which the new echo node has subscribed to.
5.6.4. Clean up#
At this point you’ll have a lot of nodes running.
Don’t forget to stop them by entering Ctrl+C in each terminal.