6.4. RViz, a 3D visualizer for ROS#
RViz is a 3D visualizer for the Robot Operating System (ROS) framework. It helps developers and users visualize and debug a robot’s sensors (e.g., to show camera feeds, LiDAR scans), physical location in a map, navigation points, and much more using 3D visualizations. It’s incredibly useful for understanding how a robot perceives its environment and for troubleshooting issues in robotics systems.
6.4.1. Starting RViz#
Don’t forget to source the setup file in a terminal, if you have not done so, otherwise you cannot start RViz.
$ source /opt/ros/humble/setup.bash
RViz is provided by the rviz2 package, and its executable is called rviz too, so you can run it with:
$ ros2 run rviz2 rviz2
though it is so common, ROS also provides an even quicker option by just typing:
$ rviz2
Warning
If you now only see a small error window with the title “RViz: waiting for master”,
then you probably tried to run the “old” rviz version from ROS 1 instead of “new” rviz2 from ROS 2.
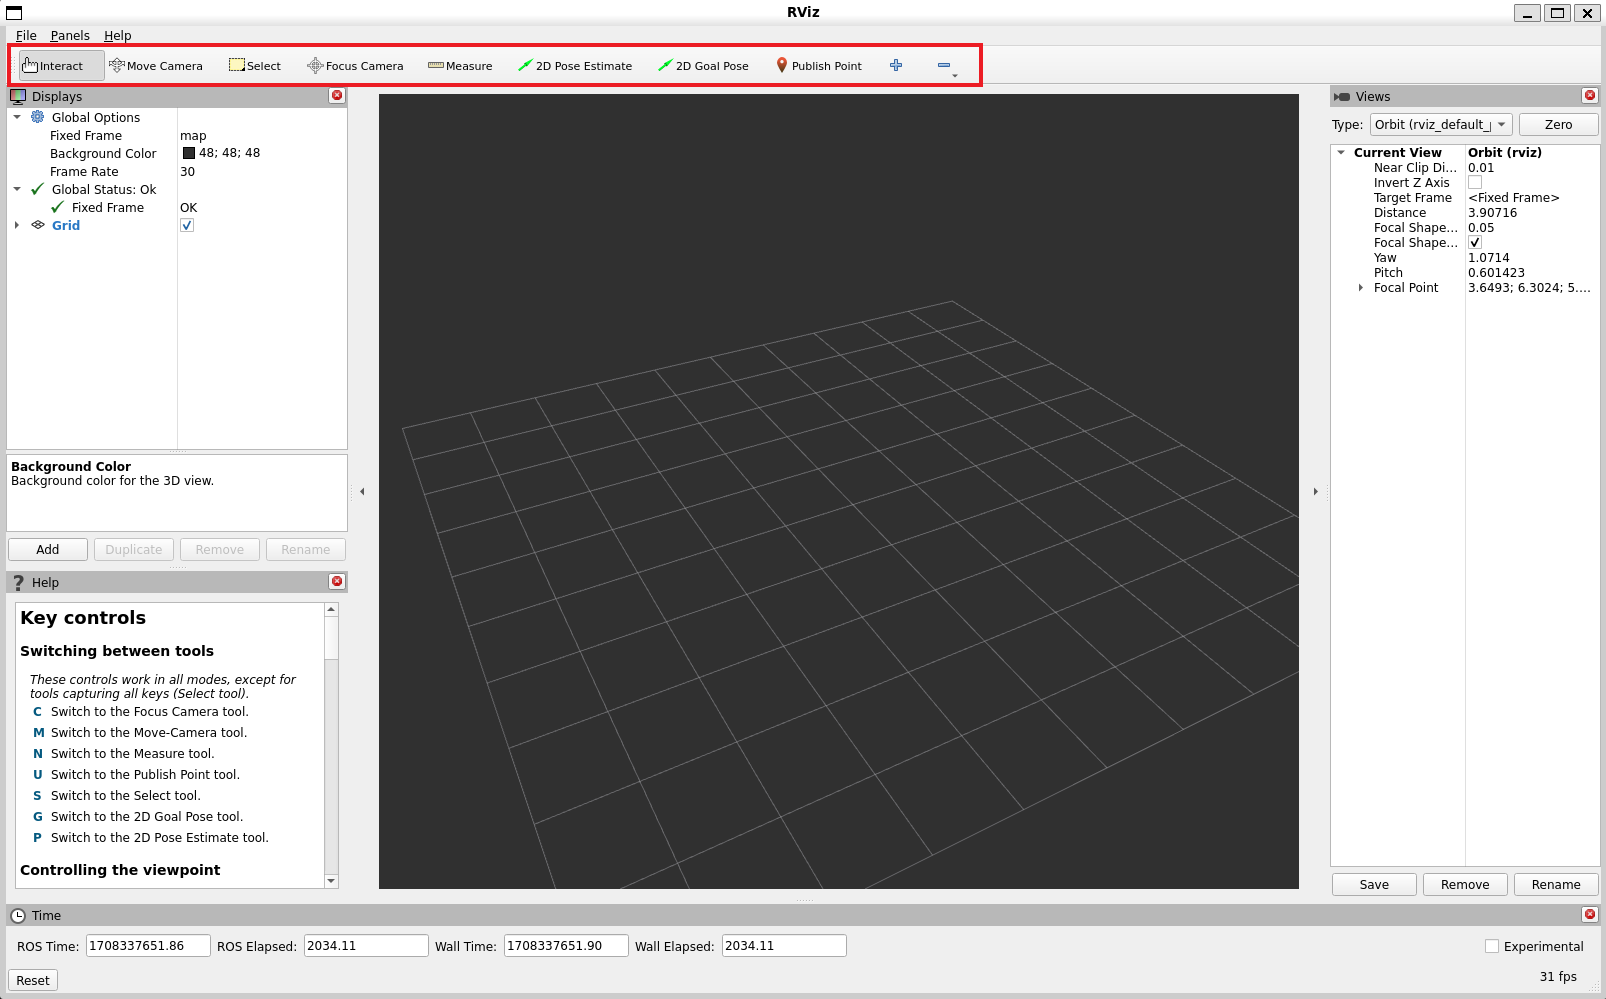
When RViz starts for the first time, you will see this window:
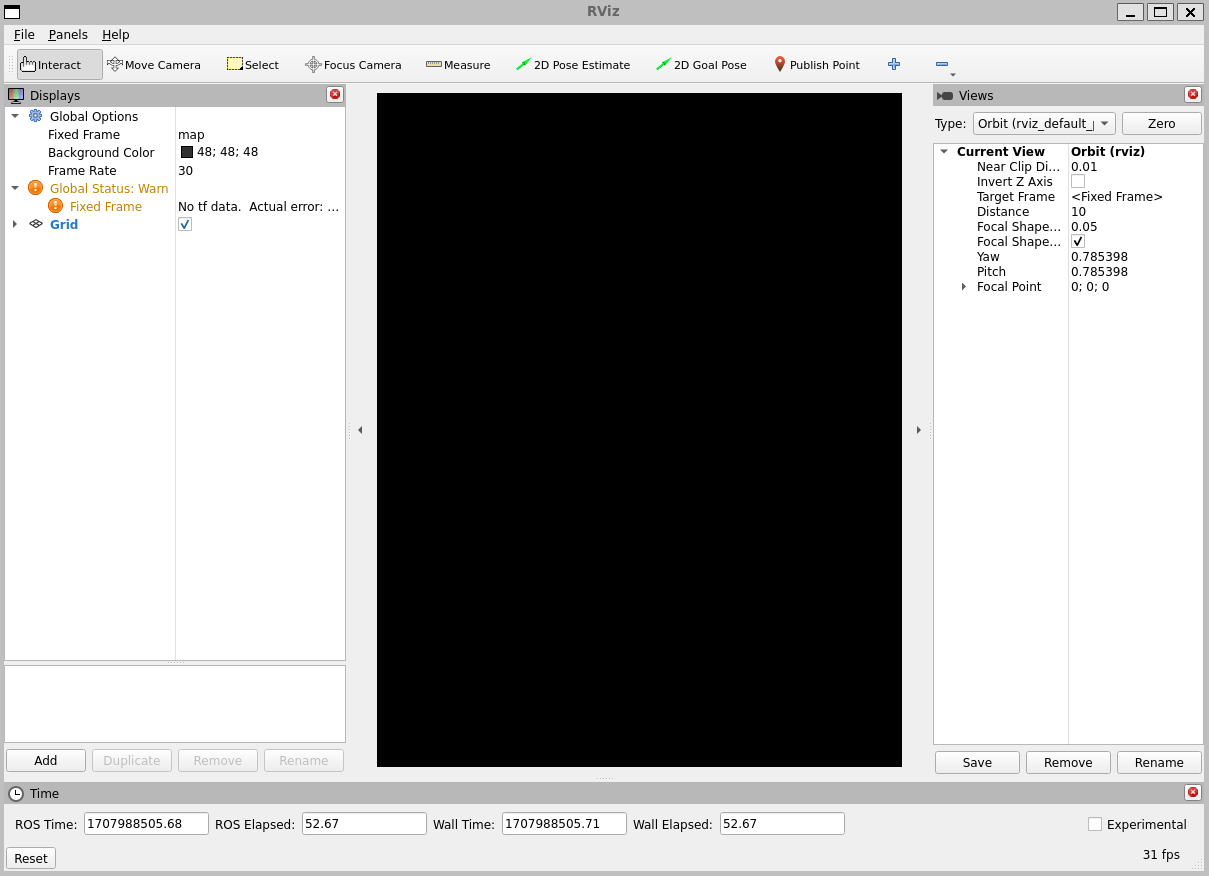
The big black window in the middle is the 3D view (empty because there is nothing to see). On the left is the Displays list, which will show any displays you have loaded. Right now it just contains the global options and a Grid, which we’ll get to later. On the right are some of the other panels, described below.
6.4.2. Displays#
A display is something that draws something in the 3D world, and likely has some options available in the displays list. An example is a point cloud, the robot state, etc.
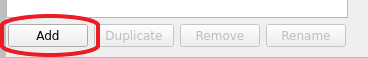
To add a display, click the Add button at the bottom:
This will pop up the new display dialog:
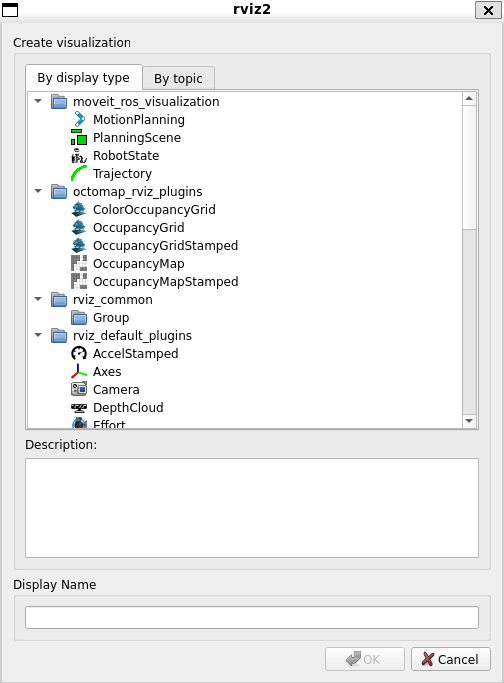
The list at the top contains the display type. The type details what
kind of data this display will visualize. The text box in the middle
gives a description of the selected display type. Finally, you must give
the display a unique name. If you have, for example, two laser scanners
on your robot, you might create two Laser Scan displays named “Laser
Base” and “Laser Head”.
Each display gets its own list of properties. For example:
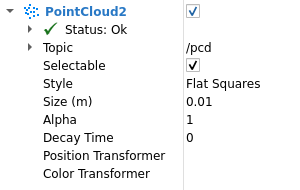
Some common properties are:
Status
Each display gets its own status to help let you know if everything is OK or not. The status can be one of:
OK,Warning,Error, orDisabled. The status is indicated in the display’s title by the background color, as well as in the Status category that you can see if the display is expanded. Here is an example of what an error could look like: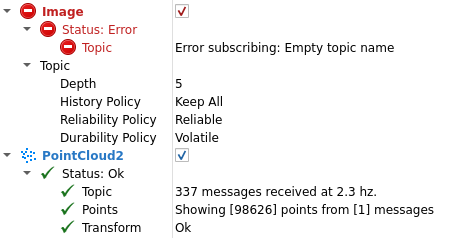
The
Statuscategory also expands to show specific status information. This information is different for different displays, and the messages should be self explanatory.Topic
Here you can select the topic that the display should subscribe to. Each display can only show one topic, so if you have multiple pointclouds from multiple LiDAR sensors, you would add a display for each. If you click on the display name, you can type the topic you want to use, but you will also see a dropdown arrow appear behind the topic name. Here you can simply select an existing topic from the list. Note that the list only shows topics of the matching message type for the display. See the built-in display reference in the next subsection.
Other properties are specific to the display type, but normally change the visual appearance of the corresponding data.
Note
Feel free to play around with the display properties!
For instance, by default RViz shows already a “Grid” topic. Try augmenting its “Plane Cell Count” from 10 to 1 or 100.
You can also change the “Background Color” property in the “Global Options”, or see what happens if you change the “Frame Rate” from 30 to 1 (hint: try moving the camera around!).
However, for now keep the “Fixed Frame” property to “map”, otherwise some other visualizations later in the tutorial will not work.
6.4.3. Built-in Display Types#
For reference, the following table shows an overview of available display types in RViz, with a short description and the messages types they are used for. This should you give an idea of the type of visualization RViz can provide.
Name |
Description |
Messages Used |
|---|---|---|
Axes |
Displays a set of Axes |
|
Effort |
Shows the effort being put into each revolute joint of a robot |
|
Camera |
Creates a new rendering window from the perspective of a camera, and overlays the image on top of it. |
|
Grid |
Displays a 2D or 3D grid along a plane |
|
Grid Cells |
Draws cells from a grid, usually obstacles from a costmap from the navigation stack. |
|
Image |
Creates a new rendering window with an Image. Unlike the Camera display, this display does not use a CameraInfo |
|
InteractiveMarker |
Displays 3D objects from one or multiple Interactive Marker servers and allows mouse interaction with them |
|
Laser Scan |
Shows data from a laser scan, with different options for rendering modes, accumulation, etc. |
|
Map |
Displays a map on the ground plane. |
|
Markers |
Allows programmers to display arbitrary primitive shapes through a topic |
visualization_msgs/msg/Marker, visualization_msgs/msg/MarkerArray |
Path |
Shows a path from the navigation stack. |
|
Point |
Draws a point as a small sphere. |
|
Pose |
Draws a pose as either an arrow or axes. |
|
Pose Array |
Draws a “cloud” of arrows, one for each pose in a pose array |
|
Point Cloud(2) |
Shows data from a point cloud, with different options for rendering modes, accumulation, etc. |
|
Polygon |
Draws the outline of a polygon as lines. |
|
Odometry |
Accumulates odometry poses from over time. |
|
Range |
Displays cones representing range measurements from sonar or IR range sensors. |
|
RobotModel |
Shows a visual representation of a robot in the correct pose (as defined by the current TF transforms). |
See Section 6.5 |
TF |
Displays the tf2 transform hierarchy. |
See Section 6.5 |
Wrench |
Draws a wrench as arrow (force) and arrow + circle (torque) |
|
Twist |
Draws a twist as arrow (linear) and arrow + circle (angular) |
6.4.4. Example: displaying some 3D markers#
Ok, let’s now try to visualize some actual message data.
For this example, we will generate MarkerArray messages, which are defined in the visualization_msgs package.
A MarkerArray message can contain zero or more Marker messages (hence, it is an “array”),
where each marker can be some basic 3D shape, with color, size, and pose information.
Markers are great for nodes that need to generate visual information to the user, such as via RViz as we are doing here.
You can see an overview of the different Marker types in this ROS (1) wiki entry on Markers (this documentation is old, but still mostly relevant for ROS 2).
Since we have not learned yet how to write our custom nodes to publish ROS nodes,
we will use the ros2 topic pub command that we learned about in an earlier section
to publish a MarkerArray for us.
Once the MarkerArray is published, we can easily add a Display for it in RViz.
The only difficulty is that for pub we need to provide the MarkerArray message as YAML,
and it will be very long and difficult to enter on the commandline directly.
Therefore, we will simply first save the message content in a file using a regular text editror,
and then just use basic bash commandline syntax to insert that file content in the pub command.
Create a YAML file for the MarkerArray message
Open a text editor in your current working directory, and use it create a new file
markerarray.yaml. For instance, you can just type in the terminalnano markerarray.yaml. Copy the following content into the file, and save it (for nano, just right mouse click on the terminal and select paste):markerarray.yaml (click this box to expand)
# This is a YAML representation of a ROS MarkerArray message
markers:
  - header:
      frame_id: "map"
      stamp:
        sec: 0
        nanosec: 0
    ns: "shapes"
    id: 0
    type: 1  # CUBE
    action: 0  # ADD
    pose:
      position:
        x: 1.0
        y: 1.0
        z: 0.0
      orientation:
        x: 0.0
        y: 0.0
        z: 0.0
        w: 1.0
    scale:
      x: 1.0
      y: 1.0
      z: 1.0
    color:
      r: 1.0
      g: 0.0
      b: 0.0
      a: 1.0

  - header:
      frame_id: "map"
      stamp:
        sec: 0
        nanosec: 0
    ns: "shapes"
    id: 1
    type: 2  # SPHERE
    action: 0  # ADD
    pose:
      position:
        x: -1.0
        y: -1.0
        z: 0.0
      orientation:
        x: 0.0
        y: 0.0
        z: 0.0
        w: 1.0
    scale:
      x: 1.0
      y: 1.0
      z: 1.0
    color:
      r: 0.0
      g: 0.0
      b: 1.0
      a: 1.0

  - header:
      frame_id: "map"
      stamp:
        sec: 0
        nanosec: 0
    ns: "shapes"
    id: 2
    type: 3  # CYLINDER
    action: 0  # ADD
    pose:
      position:
        x: 0.0
        y: 2.0
        z: 0.0
      orientation:
        x: 0.0
        y: 0.0
        z: 0.0
        w: 1.0
    scale:
      x: 1.0
      y: 1.0
      z: 1.0
    color:
      r: 0.0
      g: 1.0
      b: 0.0
      a: 1.0
Publish the MarkerArray message to a topic
Refer to the
ros2 topic pubsection for the commandline syntax. You will see that the general syntax isros2 topic pub <topic-name> <msg-type> "<yaml-content>". In our case,we will publish to a new topic called
/markers(why not, let’s keep it simple)the message type is
visualization_msgs/msg/MarkerArrayfor the message content, we will simply let our bash shell insert it by reading the
markerarray.yamlfile. Remember thatcatwrites a file content toSTDOUTstream, and that the bash syntax$(<cmd>)will substitute that part of the commandline by what it reads from theSTDOUTafter executing<cmd>.
So, putting everything together, we can use:
$ ros2 topic pub /markers visualization_msgs/msg/MarkerArray "$(cat markerarray.yaml)"
and if everything is correct, you should see some long output appear that starts with
publishing #1: visualization_msgs.msg.MarkerArray(markers=[visualization_msgs.msg.Marker(header=std_msgs.msg.Header(stamp=builtin_interfaces.msg.Time(sec=0, nanosec=0), frame_id='map'), ns='spheres', id=0, type=2, action=0, pose=geometry_msgs.msg.Pose(position=geometry_msgs.msg.Point(x=1.0, y=1.0, z=1.0), orientation=geometry_msgs.msg.Quaternion(x=0.0, y=0.0, z=0.0, w=1.0)), scale=geometry_msgs.msg.Vector3(x=0.2, y=0.2, z=0.2), color=std_msgs.msg.ColorRGBA(r=1.0, g=0.0, b=0.0, a=1.0), lifetime=builtin_interfaces.msg.Duration(sec=0, nanosec=0), frame_locked=False, points=[], colors=[], texture_resource='', texture=sensor_msgs.msg.CompressedImage(header=std_msgs.msg.Header(stamp=builtin_interfaces.msg.Time(sec=0, nanosec=0), frame_id=''), format='', data=[]), uv_coordinates=[], text='', mesh_resource='', mesh_file=visualization_msgs.msg.MeshFile(filename='', data=[]), mesh_use_embedded_materials=False), visualization_msgs.msg.Marker(header=std_msgs.msg.Header(stamp=builtin_interfaces.msg.Time(sec=0, nanosec=0), frame_id='map'), ns='spheres', id=1, type=2, action=0, pose=geometry_msgs.msg.Pose(position=geometry_msgs.msg.Point(x=2.0, y=2.0, z=2.0), orientation=geometry_msgs.msg.Quaternion(x=0.0, y=0.0, z=0.0, w=1.0)), scale=geometry_msgs.msg.Vector3(x=0.3, y=0.3, z=0.3), color=std_msgs.msg.ColorRGBA(r=0.0, g=1.0, b=0.0, a=1.0), lifetime=builtin_interfaces.msg.Duration(sec=0, nanosec=0), frame_locked=False, points=[], colors=[], texture_resource='', texture=sensor_msgs.msg.CompressedImage(header=std_msgs.msg.Header(stamp=builtin_interfaces.msg.Time(sec=0, nanosec=0), frame_id=''), format='', data=[]), uv_coordinates=[], text='', mesh_resource='', mesh_file=visualization_msgs.msg.MeshFile(filename='', data=[]), mesh_use_embedded_materials=False), visualization_msgs.msg.Marker(header=std_msgs.msg.Header(stamp=builtin_interfaces.msg.Time(sec=0, nanosec=0), frame_id='map'), ns='spheres', id=2, type=2, action=0, pose=geometry_msgs.msg.Pose(position=geometry_msgs.msg.Point(x=3.0, y=3.0, z=3.0), orientation=geometry_msgs.msg.Quaternion(x=0.0, y=0.0, z=0.0, w=1.0)), scale=geometry_msgs.msg.Vector3(x=0.4, y=0.4, z=0.4), color=std_msgs.msg.ColorRGBA(r=0.0, g=0.0, b=1.0, a=1.0), lifetime=builtin_interfaces.msg.Duration(sec=0, nanosec=0), frame_locked=False, points=[], colors=[], texture_resource='', texture=sensor_msgs.msg.CompressedImage(header=std_msgs.msg.Header(stamp=builtin_interfaces.msg.Time(sec=0, nanosec=0), frame_id=''), format='', data=[]), uv_coordinates=[], text='', mesh_resource='', mesh_file=visualization_msgs.msg.MeshFile(filename='', data=[]), mesh_use_embedded_materials=False)]
...etc...
Add a MarkerArray display in RViz
In RViz, add a new display. In the popup menu, it is easiest if you click the tab “By topic” (we don’t have many topics). You should see the
/markerstopic in the list, with under it a MarkerArray display. Double click this display options.Now the MarkerArray display is added, and already configured for the correct topic. If everything is correct, you should see three colored sphere markers in the center display, like this:
 You can use the mouse to click and drag the center display to rotate the camera around the markers.
6.4.5. Configurations#
Different configurations of displays are often useful for different uses of the visualizer. A configuration useful for a Mirte robot is not necessarily useful for a robot arm, for example. To this end, the visualizer lets you load and save different configurations.
A configuration contains:
Displays + their properties
Tool properties
The viewpoint and settings for the 3D visualization
After you have changed the configuration of RViz, for example by adding some Displays or changing the Background Color in the Global Options,
use the File -> Save Config As ... menu option to save the configuration in a file.
Now close RViz, and then start it up again.
You should see that RViz shows the empty default configuration again.
Via the File -> Open Config menu option, you should now be able to load the configuration file again, and recover the displays and their layout as you had before.
You can also directly start RViz with your custom configuration file by using the -d argument, for example
$ ros2 run rviz2 rviz2 -d <config_filename>
where <config_filename> is the name or path to the configuration file.
Note that RViz by default saves configuration files using the .rviz file extension.
6.4.6. Time#
The Time panel is mostly useful when running in a simulator or replaying a rosbag, since it
allows you to see how much ROS Time has passed, vs. how much Wall Clock (a.k.a. real) time has passed.
Note
The concepts of ROS Time and wall clock time were discussed in Section 6.3.7.
The time panel also lets you reset the visualizer’s internal time state, which resets of all the displays (as well as RViz’s internal cache of the TF tree, which will be discussed in Section 6.5).

If you are not running in simulation or playing a bag, the time panel is mostly useless. In most cases it can be closed and you will probably not even notice (other than having a bit more screen real estate for the rest of RViz).
Exercise 6.3
Recall that to make any node perceive a simulated ROS Time,
you need to set the node’s use_sim_time parameter to true when you start the node,
and have a source for the /clock topic.
First start RViz normally, and in another terminal, replay a rosbag at a significantly reduced rate:
For instance, use the subset bag recorded in Section 6.3.3:
$ ros2 bag play subset --clock -r 0.01 -l
We can verify the /clock topic is being published to by using a simple ros2 topic echo /clock.
Do you observe any difference between the ROS Time and Wall Time in RViz’s Time panel?
Next, stop RViz and then restart it with its use_sim_time parameter set to true:
$ ros2 run rviz2 rviz2 --ros-args -p use_sim_time:=true
What do you observe now in RViz’s Time panel?
Try pausing the rosbag (use SPACE bar in the bag player’s terminal), and see what happens in the Time panel.
6.4.7. Coordinate Frames#
Note
RViz uses the “TF transform” system for transforming data from the 3D coordinate frame it arrives in into a global 3D reference frame used for its main 3D view in the middle. TF transforms will be discussed in Section 6.5, so the concepts discussed here might be clearer once you have read that section.
RViz uses two TF coordinate frames that are important to know about in the visualizer, the fixed frame and the target frame.
The Fixed Frame
The more-important of the two frames is the fixed frame. The fixed frame is the reference frame used to denote the world frame. This is usually the
maporworldTF frame, or something similar, but can also be, for example,odom, i.e. your robot’s odometry TF frame.If the fixed frame is erroneously set to, say, the base of the robot, then all the objects the robot has ever seen will appear in front of the robot, at the position relative to the robot at which they were detected. For correct results, the fixed frame should not be moving relative to the real-world world.
If you change the fixed frame, all data currently being shown is cleared rather than re-transformed.
The Target Frame
The target frame is the reference frame for the camera view. For example, if your target frame is the map, you’ll see the robot driving around the map. If your target frame is the base of the robot, the robot will stay in the same place while everything else moves relative to it.
6.4.8. Views Panel#
Note
This section is mostly provided as a reference. You can try out the effect of changing the view yourself as you work with RViz.
There are a number of different camera types available in the visualizer.
Camera types consist both of different ways of controlling the camera and different types of projection (Orthographic vs. Perspective).
Orbital Camera (default)
The orbital camera simply rotates around a focal point, while always looking at that point. The focal point is visualized as a small disc while you’re moving the camera:
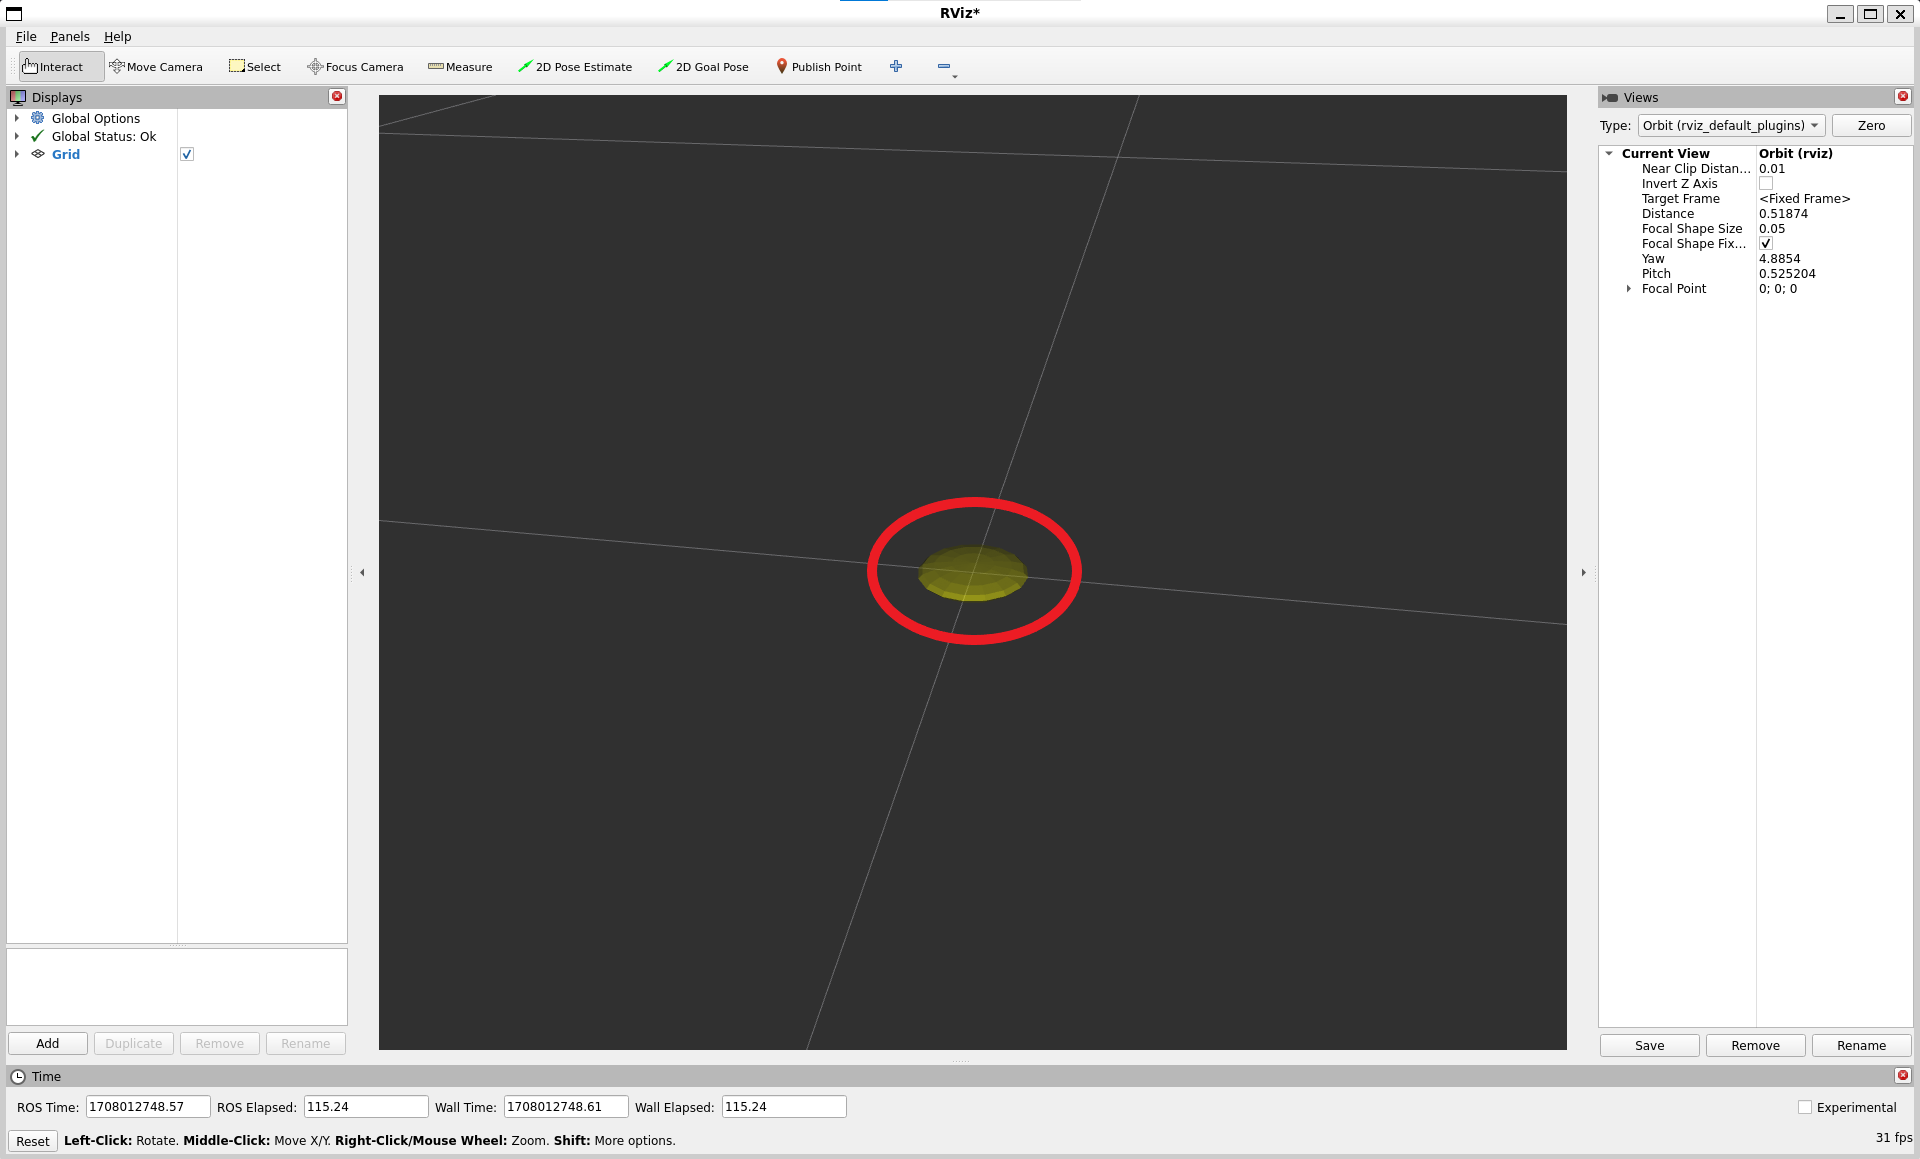
Controls:
Left mouse button: Click and drag to rotate around the focal point.
Middle mouse button: Click and drag to move the focal point in the plane formed by the camera’s up and right vectors. The distance moved depends on the focal point – if there is an object on the focal point, and you click on top of it, it will stay under your mouse.
Right mouse button: Click and drag to zoom in/out of the focal point. Dragging up zooms in, down zooms out.
Scrollwheel: Zoom in/out of the focal point
FPS (first-person) Camera
The FPS camera is a first-person camera, so it rotates as if you’re looking with your head.
Controls:
Left mouse button: Click and drag to rotate. Control-click to pick the object under the mouse and look directly at it.
Middle mouse button: Click and drag to move along the plane formed by the camera’s up and right vectors.
Right mouse button: Click and drag to move along the camera’s forward vector. Dragging up moves forward, down moves backward.
Scrollwheel: Move forward/backward.
Top-down Orthographic
The top-down orthographic camera always looks down along the Z axis (in the robot frame), and is an orthographic view which means things do not get smaller as they get farther away.
Controls:
Left mouse button: Click and drag to rotate around the Z axis.
Middle mouse button: Click and drag to move the camera along the XY plane.
Right mouse button: Click and drag to zoom the image.
Scrollwheel: Zoom the image.
XY Orbit
Same as the orbital camera, with the focus point restricted to the XY plane.
Controls:
See orbital camera.
Third Person Follower
The camera maintains a constant viewing angle towards the target frame. In contrast to XY Orbit the camera turns if the target frame yaws. This could be handy if you are doing 3D mapping of a hallway with corners for example.
Controls:
See orbital camera.
Custom Views
The views panel also lets you create different named views, which are saved and can be switched between. A view consists of a target frame, camera type and camera pose. You can save a view by clicking the Save button of the views panel.
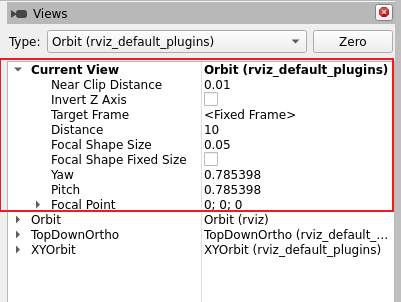
A view consists of:
View controller type
View configuration (position, orientation, etc; possibly different for each view controller type.)
The Target Frame
Views are saved per user, not in the config files.
6.4.9. Tools#
Note
This section is mostly provided as a reference. You can try out the effects of using these tools yourself as you work with RViz.
The RViz visualizer has a number of tools you can use on the toolbar. The following sections will give a short introduction into these tools. You can find some more information under Help -> Show Help panel.
Interact
This tool lets you interact with the visualized environment. You can click on objects and depending on their properties simply select them, move them around and much more.
Keyboard shortcut:
iMove Camera
The Move Camera tool is the default tool. When this is selected and you click inside the 3D view, the viewpoint changes according to the options and camera type you have selected in the
Viewspanel. See the previous sectionViews Panelfor more information.Keyboard shortcut:
mSelect
The Select tool allows you to select items being displayed in the 3D view. It supports single-point selection as well as click/drag box selection. You can add to a selection with the Shift key, and remove from the selection with the Ctrl key. If you want to move the camera around while selecting without switching back to the Move Camera tool you can hold down the Alt key. The
fkey will focus the camera on the current selection.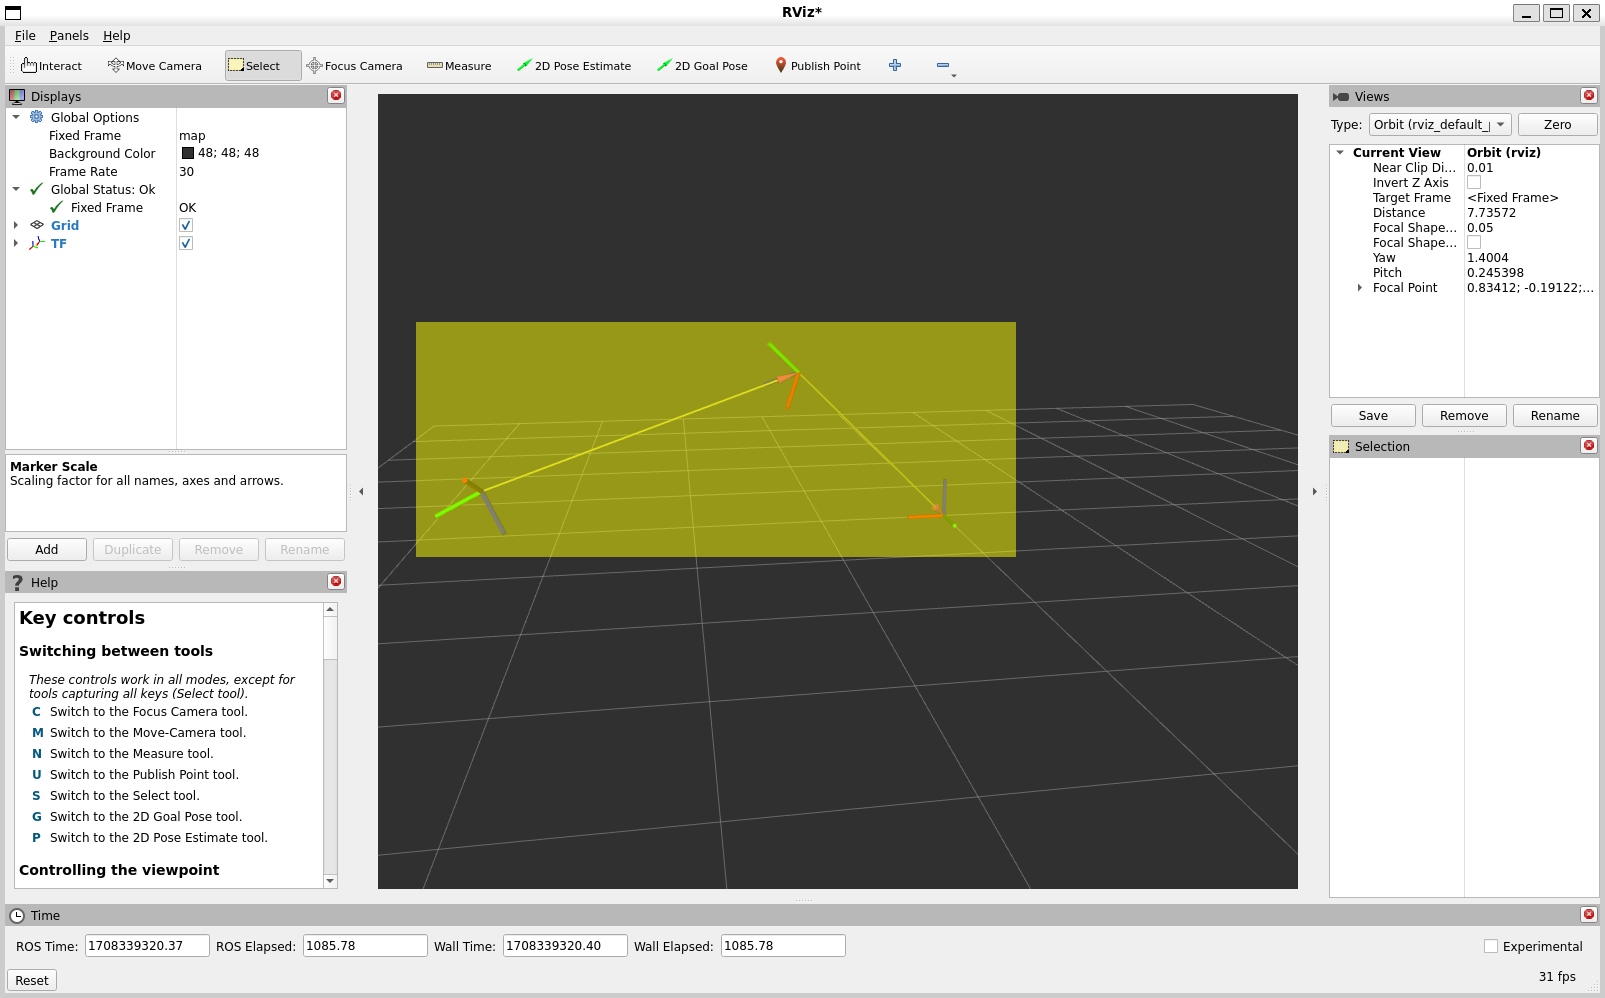
Keyboard shortcut:
sFocus Camera
Focus camera lets you select a location in the visualizer. The camera will then focus that point by changing its orientation but not its position.
Keyboard shortcut:
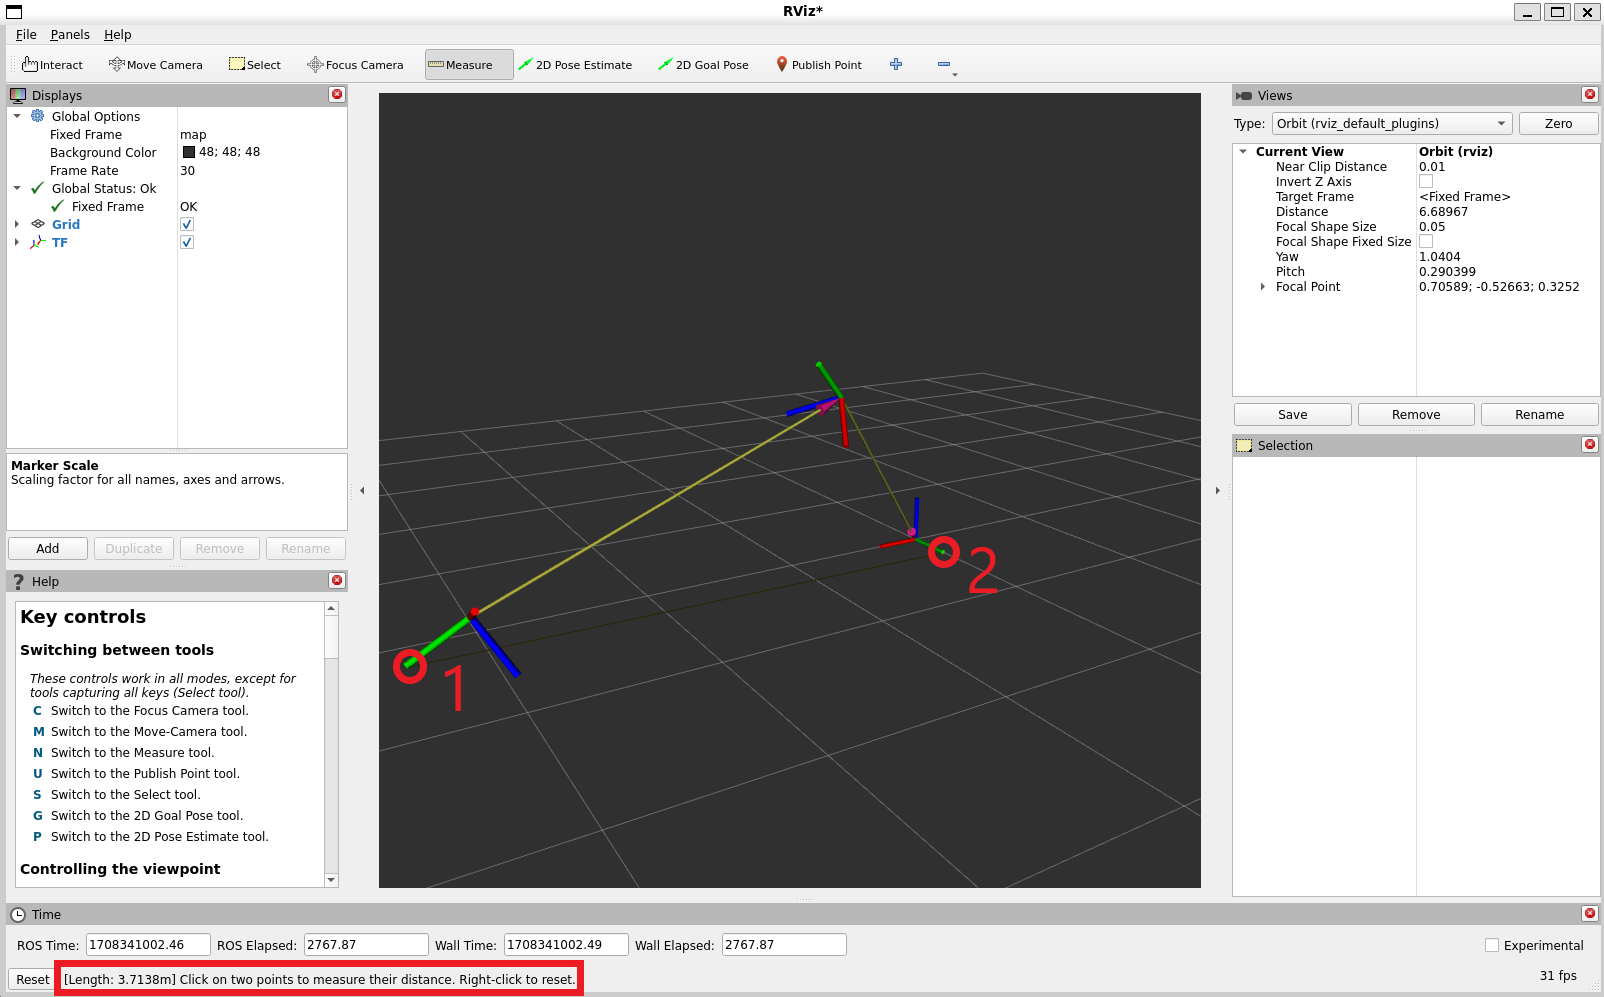
cMeasure
With the measure tool you can measure the distance between to points in the visualizer. The first click after activating the tool will set the starting point and the second one the end point of the measurement. The resulting distance will be displayed at the bottom of the RViz window. But notice that the measurement tool only works with actually rendered objects in the visualizer, you can not use it in empty space.
Keyboard shortcut:
n2D Pose Estimate
This tool lets you set an initial pose to seed the localization system (sent on the
initialposeROS topic). Click on a location on the ground plane and drag to select the orientation. The output topic can be changed in theTool Propertiespanel.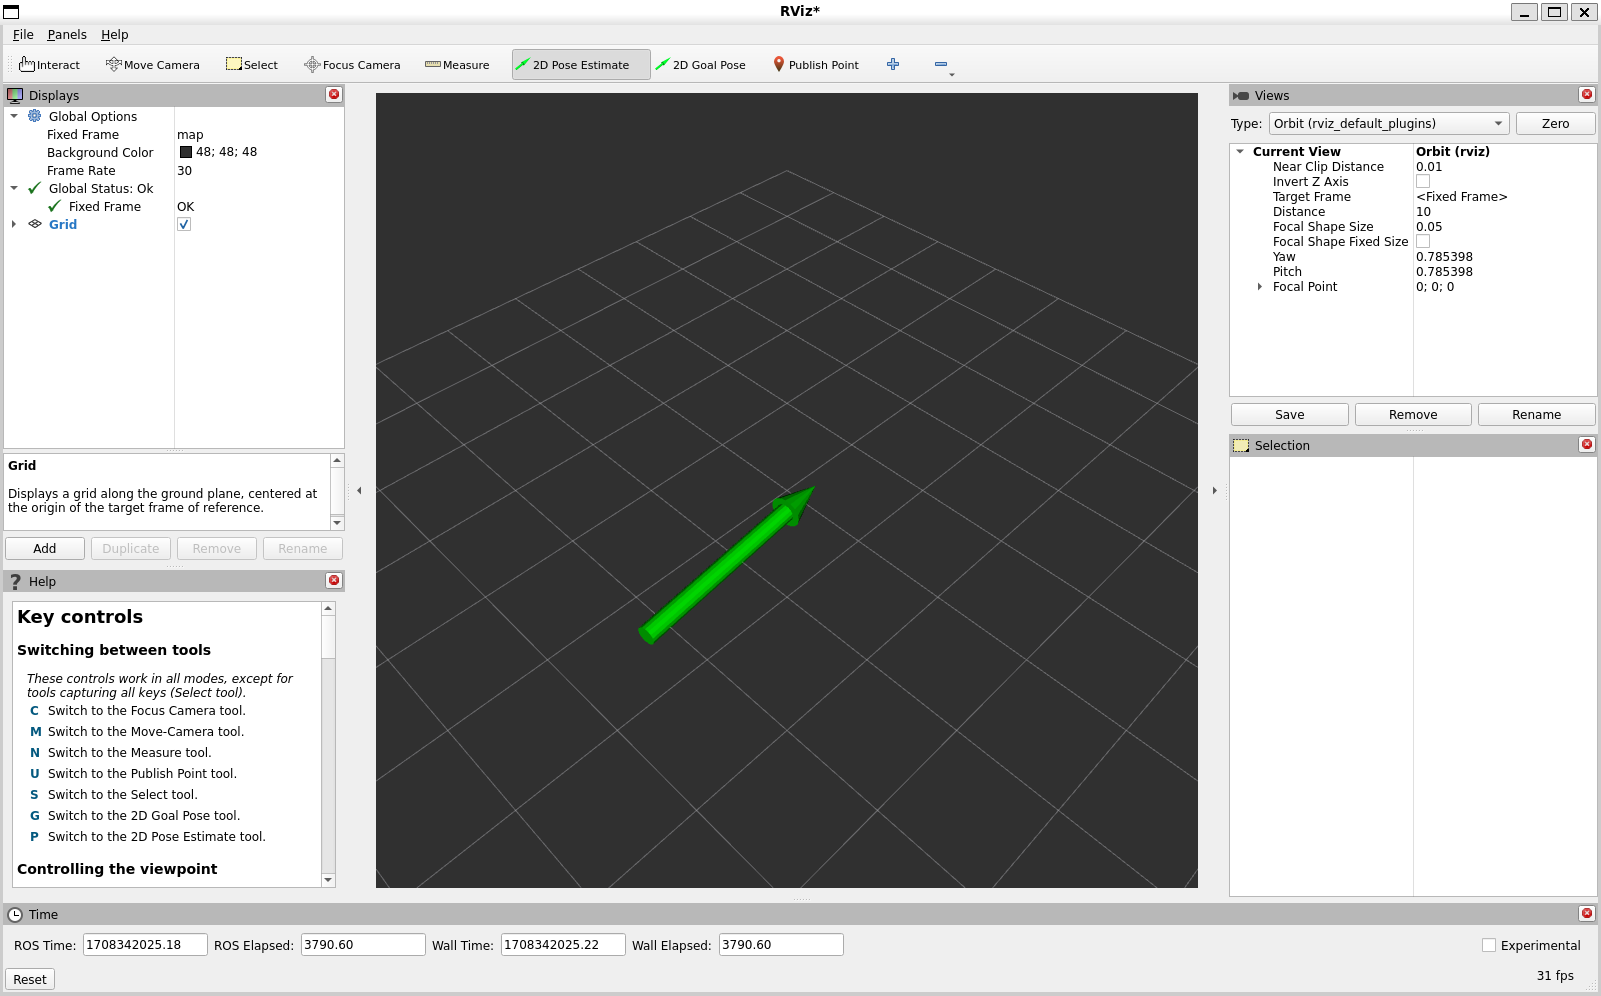
This tool works with the navigation stack.
Keyboard shortcut:
p2D Nav Goal
This tool lets you set a goal sent on the
goal_poseROS topic. Click on a location on the ground plane and drag to select the orientation. The output topic can be changed in theTool Propertiespanel.This tool works with the navigation stack.
Keyboard shortcut:
gPublish Point
The publish point tool lets you select an object in the visualizer and the tool will publish the coordinates of that point based on the frame. The results are shown at the bottom like with the measure tool but are also published on the
/clicked_pointtopic.Keyboard shortcut:
u
Exercise 6.4
Open RViz if you have not done so yet.
In another terminal, use ros2 topic to echo the /clicked_point topic.
In RViz, select the Publish Point tool, and click on some part of the 3D scene that is not the background.
For instance, you can click on a line of the default Grid display.
What information do you see being published on /clicked_point when you click?
What is the message type of this topic?